Blogs > How to Build a Nursing Concept Map That Actually Improves Clinical Judgment
How to Build a Nursing Concept Map That Actually Improves Clinical Judgment
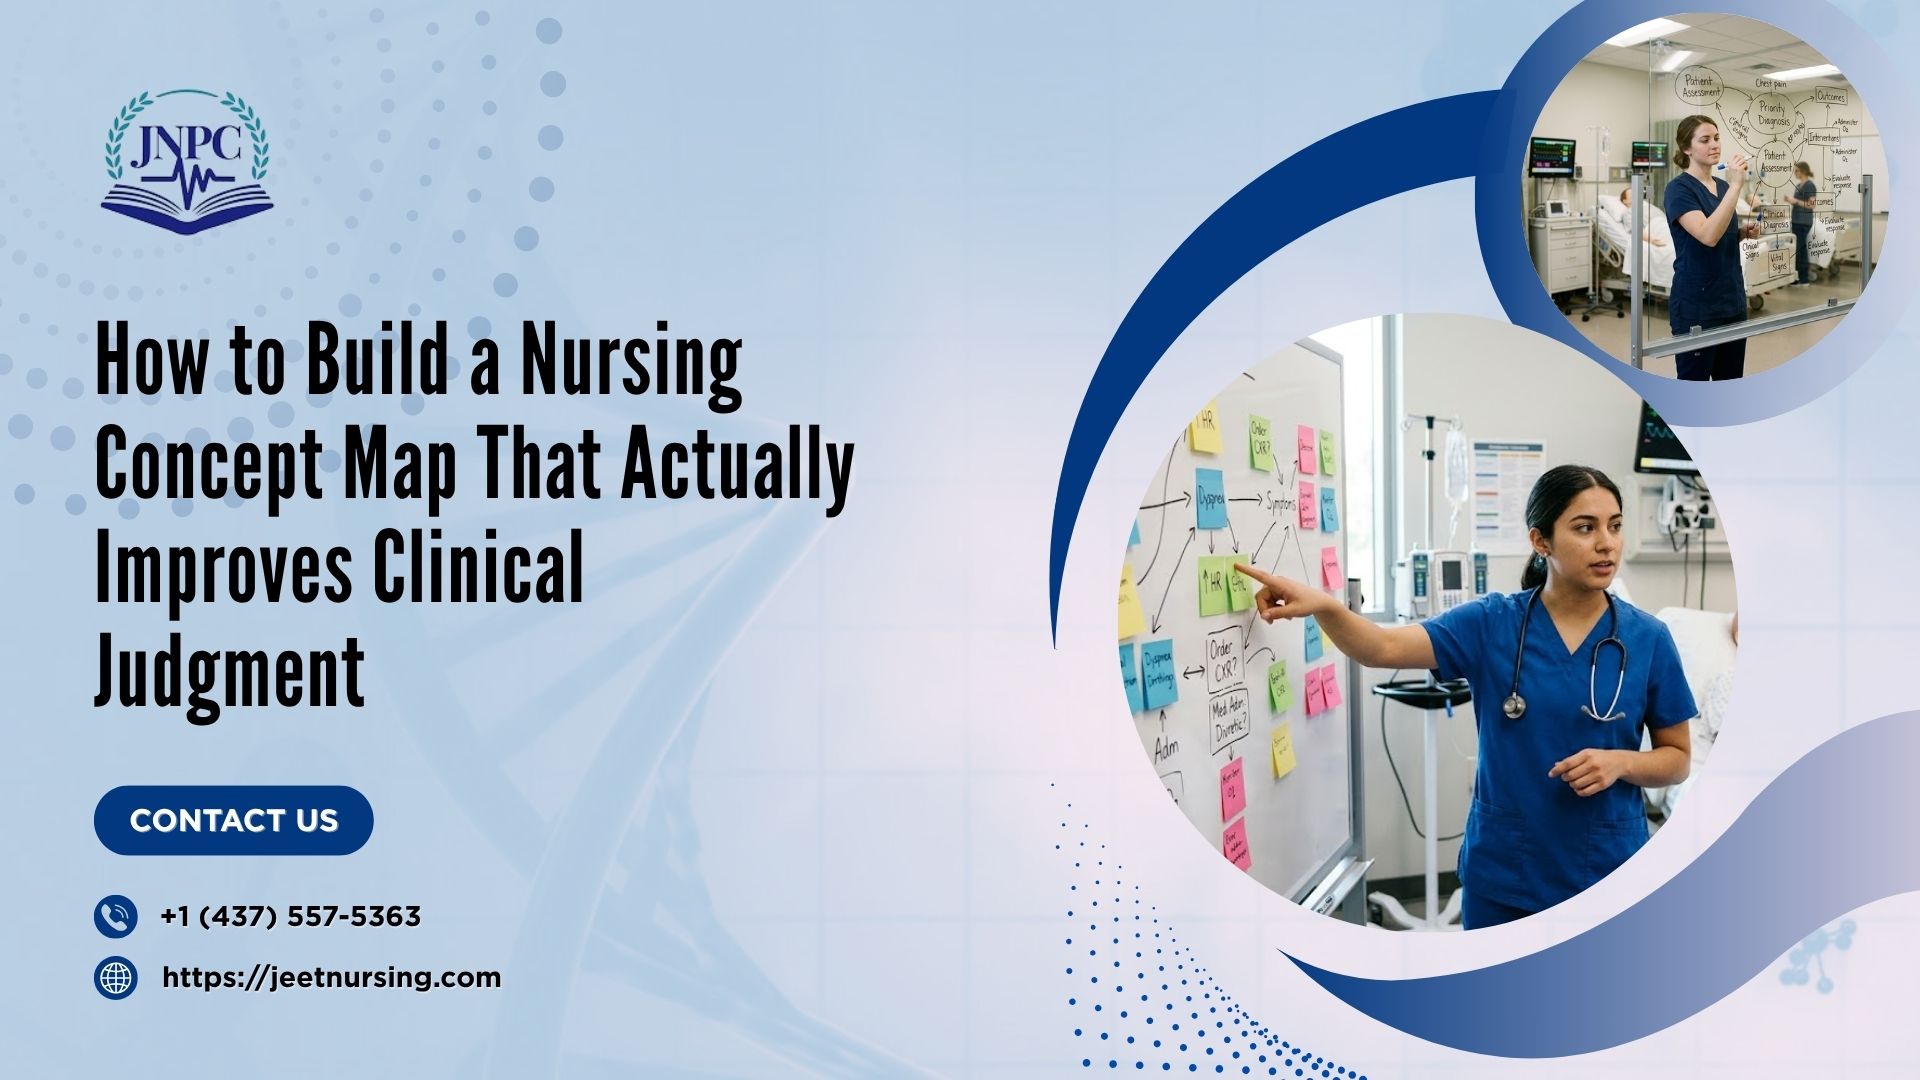

If you've ever stared at a blank page trying to turn a messy set of patient data into something that actually makes sense, you already know why concept maps exist. Most nursing students are taught to draw bubbles and connect them with arrows, but very few are taught why those connections matter. A concept map isn't a homework formality - done right, it's one of the sharpest tools in your nursing prep toolkit for building real clinical reasoning, the kind that carries over directly into NCLEX-style questions and real bedside decisions.
This guide breaks down what a nursing concept map actually is, why it works, and how to build one step by step - with a worked example so you're not left guessing how the pieces fit together.
What Is a Nursing Concept Map?
A nursing concept map is a visual diagram that organizes a patient's data - assessment findings, diagnoses, interventions, and expected outcomes - around a central patient snapshot, with lines showing how each piece connects to the others. Instead of reading information in a straight list, you see it as a web of relationships.
How it differs from a traditional written care plan: A written care plan is linear - you list a diagnosis, then interventions, then outcomes, one section after another, usually in a table. A concept map is spatial. It forces you to physically draw the connection between, say, a patient's crackles on auscultation and their diagnosis of excess fluid volume, rather than just listing both facts separately. That visual linking is what makes concept maps more effective for developing clinical judgment than a static template.
Where it fits in the nursing process (ADPIE): A concept map essentially takes every stage of the nursing process - Assessment, Diagnosis, Planning, Implementation, Evaluation and lays it out on one page at the same time, so you can see the whole clinical picture instead of moving through it step by step in isolation.
Why Nurses and Students Actually Use Them
Builds clinical judgment - it connects the dots between data. The real value of a concept map is that it forces you to explain why one piece of data relates to another. Anyone can memorize that heart failure causes edema. A concept map makes you draw the line between the two and label it, which is a very different cognitive task and it's exactly the kind of reasoning the NCSBN Clinical Judgment Measurement Model expects you to demonstrate. If you want a deeper breakdown of how examiners actually assess this skill, our earlier piece on clinical judgment in nursing walks through the six-step model in detail.
The NCLEX and clinical-reasoning angle. Modern NCLEX questions, especially Next Generation NCLEX (NGN) case studies, don't just test recall - they test whether you can recognize cues, analyze them, prioritize hypotheses, and generate solutions. That's the same mental sequence a concept map trains you to do on paper before you ever sit the exam.
Communication tool between care team members. In clinical settings, a well-built concept map can double as a quick-reference tool during handover or case conferences, showing at a glance what's going on with a patient and why certain interventions were chosen.
A brief nod to research backing. Nursing education literature has consistently linked concept mapping to measurable improvements in critical thinking scores among students, largely because the exercise requires active synthesis rather than passive review.
The Building Blocks: What Goes Into Every Map
Every solid concept map, regardless of format, contains the same core pieces:
Central concept (patient snapshot): Age, admitting diagnosis, key history, and chief complaint - the "who is this patient" summary that sits in the middle of the page.
Assessment clusters (subjective/objective data): Group your findings - vital signs, lab values, what the patient reports, physical exam findings - into logical clusters rather than one long list.
Nursing diagnoses (NANDA format): Written as problem related to etiology as evidenced by signs/symptoms. This is where many students get sloppy, and it's worth slowing down here.
Interventions: The specific nursing actions tied to each diagnosis, ideally written so they could stand alone as an order.
Expected outcomes/evaluation: The measurable goal you're working toward, and how you'll know the intervention worked.
Miss any one of these and the map stops functioning as a reasoning tool - it becomes decoration.
Four Ways to Structure One - Which Fits Your Case?
Not every patient scenario fits the same shape. Here are the four most common formats:
Spider map: A central concept with clusters branching outward like legs on a spider. Best for patients with one clear primary diagnosis and several related problems.
Hierarchical map: Organized top-down, from broad category to specific detail. Works well when you're teaching or reviewing a body system in a structured way.
Flowchart: Sequential, arrow-driven format. Best suited to conditions with a clear cause-and-effect progression, like a post-op recovery timeline.
System/cause-and-effect map: Shows how one problem triggers another across body systems - ideal for complex, multi-system patients like sepsis or heart failure with comorbidities.
One-line guidance: if your patient has one dominant problem, go spider; if the case is sequential, go flowchart; if it's multi-system and interconnected, use a cause-and-effect map.
Building a Map Step by Step
Gather your data. Pull everything from the chart - history, vitals, labs, meds, physician notes.
Identify the central concept. What's the primary reason this patient is under your care right now?
Cluster assessment findings. Group related subjective and objective data together instead of listing them randomly.
Prioritize diagnoses using ABC or Maslow. Airway, breathing, circulation first; then move up Maslow's hierarchy for anything not immediately life-threatening.
Link SMART interventions. Every intervention should be Specific, Measurable, Achievable, Relevant, and Time-bound - not a vague action like "monitor patient."
Step back and interpret. This is the step most students skip entirely: ask yourself "what does this cluster of findings actually tell me about this patient?" before moving to interventions. This is the difference between a map that just displays data and one that shows reasoning.
Evaluate and revise. A concept map isn't static. As new data comes in, your map should change with it.
Worked Example: Concept Map for Heart Failure
Let's walk through a simplified version using a common medical-surgical case - a patient admitted with exacerbated heart failure.
Central concept: 68-year-old male, admitted with shortness of breath and lower extremity edema, history of hypertension and prior MI.
Assessment cluster 1 (Respiratory/Fluid): Crackles bilateral bases, SpO2 91% on room air, 3+ pitting edema, weight gain of 4 lbs in 2 days, elevated BNP.
Assessment cluster 2 (Cardiac): Tachycardia, S3 heart sound, reports fatigue with minimal exertion.
Nursing diagnosis: Excess fluid volume related to compromised cardiac pumping ability as evidenced by crackles, edema, and rapid weight gain.
Interventions: Daily weights at the same time each morning, strict intake and output monitoring, administer prescribed diuretics and monitor electrolytes, position in semi-Fowler's to ease breathing, low-sodium diet education.
Expected outcome: Patient will demonstrate reduced fluid overload as evidenced by weight trending down toward baseline and clear lung sounds within 48–72 hours.
The interpretation step: Here's where the map earns its keep. Looking at the cluster together - crackles, weight gain, edema, elevated BNP - the pattern tells you this isn't just "a symptom," it's fluid volume overload secondary to reduced cardiac output. That single interpretive sentence is what separates a student who's just filling in boxes from one who's actually reasoning clinically - and it's exactly the skill that carries over when you're reviewing medication classes and side effects for this kind of case, which is a topic we cover in more depth in our guide to the NCLEX pharmacology framework.
Common Mistakes Students Make (and How to Fix Them)
Overloading bubbles with paragraphs instead of key terms. A map should be scannable in seconds. Use short phrases, not full sentences, inside each bubble.
Confusing medical diagnosis with nursing diagnosis. "Heart failure" is a medical diagnosis. "Excess fluid volume related to decreased cardiac output" is a nursing diagnosis. Keep the language nurse-focused, not physician-focused.
Skipping the "why" - missing cross-links between clusters. If your respiratory findings and your fluid volume diagnosis aren't visually connected, you've missed the point of the exercise. Draw the line and label it.
Not updating the map as patient status changes. A map made on admission day should look different by discharge. Treat it as a living document, not a one-time assignment.
Digital vs. Hand-Drawn: Tools Worth Trying
Hand-drawing is still the fastest way to think through a case, especially during clinical rotations when you need something quick. But for study review or group work, digital tools have their place:
Word or PowerPoint templates — simple, familiar, easy to edit, but limited on visual flexibility.
Canva — great for making maps look clean and shareable, though it's built more for design than clinical logic.
MindMeister — purpose-built for mind mapping with easy drag-and-drop branching, useful for quick brainstorming.
Draw.io — free and flexible, good for flowchart-style or system maps with lots of connecting lines.
Lucidchart — polished and collaborative, useful if you're working on a map with classmates in real time.
None of these tools does the thinking for you - they just make the final version easier to read and revise.
Quick Reference: Color-Coding and Formatting Tips
Use one consistent color for assessment data, another for diagnoses, and a third for interventions.
Keep bubble text to 3–6 words wherever possible.
Use solid lines for direct cause-effect links and dashed lines for indirect or contributing factors.
Number your diagnoses in priority order so the hierarchy is visible at a glance.
Leave white space - a cluttered map is as unhelpful as a missing one.
Final Thoughts
A nursing concept map is only as useful as the thinking behind it. The bubbles and arrows are just the visible output - what actually improves your clinical judgment is the discipline of clustering data, asking "why," and connecting findings the way you would at the bedside. Practiced consistently, this habit shows up not just on care plans but in how you approach NGN case studies, prioritization questions, and real patient scenarios once you're licensed.
If concept mapping and clinical-reasoning skills like this feel like an area you want more structured support with, that's exactly what focused nursing prep is meant to build over time - one clinical judgment skill at a time, rather than last-minute memorization. At Jeet Nursing Prep Centre, our live classes for NCLEX-RN, NCLEX-PN, REx-PN, and CPNRE are built around this kind of reasoning practice, not just content review, because that's ultimately what gets tested - and what matters once you're working the floor. Whether you're looking for structured nursing test prep, an NCLEX prep course with mock tests, or simply want guidance on where to start, our team at Jeet Nursing Prep Centre is ready to help you build a study plan that fits your timeline.
Ready to strengthen your clinical judgment before exam day? Contact us for a free counselling session and find out which nursing prep course fits where you are right now.
Frequently Asked Questions
1. Is a nursing concept map the same as a care plan?
No. A care plan is usually a linear, written document, while a concept map is a visual diagram that shows how assessment data, diagnoses, interventions, and outcomes connect to one another. Many instructors use concept maps as a study version of a care plan because they make clinical relationships easier to see.
2. How many nursing diagnoses should be on one concept map?
There's no fixed number, but most student maps work best with 2–4 prioritized diagnoses. Trying to map every possible diagnosis for a patient usually creates clutter and makes it harder to see the primary clinical picture, which defeats the purpose of the exercise.
3. Do concept maps actually help with NCLEX preparation?
Yes. Concept maps train the same skills the Next Generation NCLEX tests - recognizing cues, clustering data, and prioritizing hypotheses - rather than just memorizing facts. Students who build this habit early tend to find NGN case studies more manageable during their nursing prep.
4. Can concept maps be used for NCLEX-PN, REx-PN, or CPNRE prep too, or only NCLEX-RN?
Concept mapping applies across all four exams - NCLEX-RN, NCLEX-PN, REx-PN, and CPNRE - since each one tests clinical reasoning and prioritization in some form. The scope of the patient scenarios may differ by exam level, but the mapping process stays the same.
5. How long should it take to build one concept map?
Once you're comfortable with the process, a focused map for a single patient scenario usually takes 20–30 minutes. Early on, it may take longer simply because you're still learning to cluster data and write nursing diagnoses correctly - that speed builds with practice.
6. What's the biggest mistake students make with concept maps?
Treating them as a formatting exercise instead of a reasoning one. Filling in bubbles without stopping to ask "what does this data actually tell me about the patient" is the single most common mistake, and it's the one that removes most of the clinical-judgment benefit of doing the map at all.